


Since 1960, Earth's forest cover has shrunk about 1m sq km while cropland, pastures have increased
Earth's skin is stretched across 510 million km2, 361 million km2 is water, about 15 million km2 is covered by ice with 134 million km2 is ice-free land.

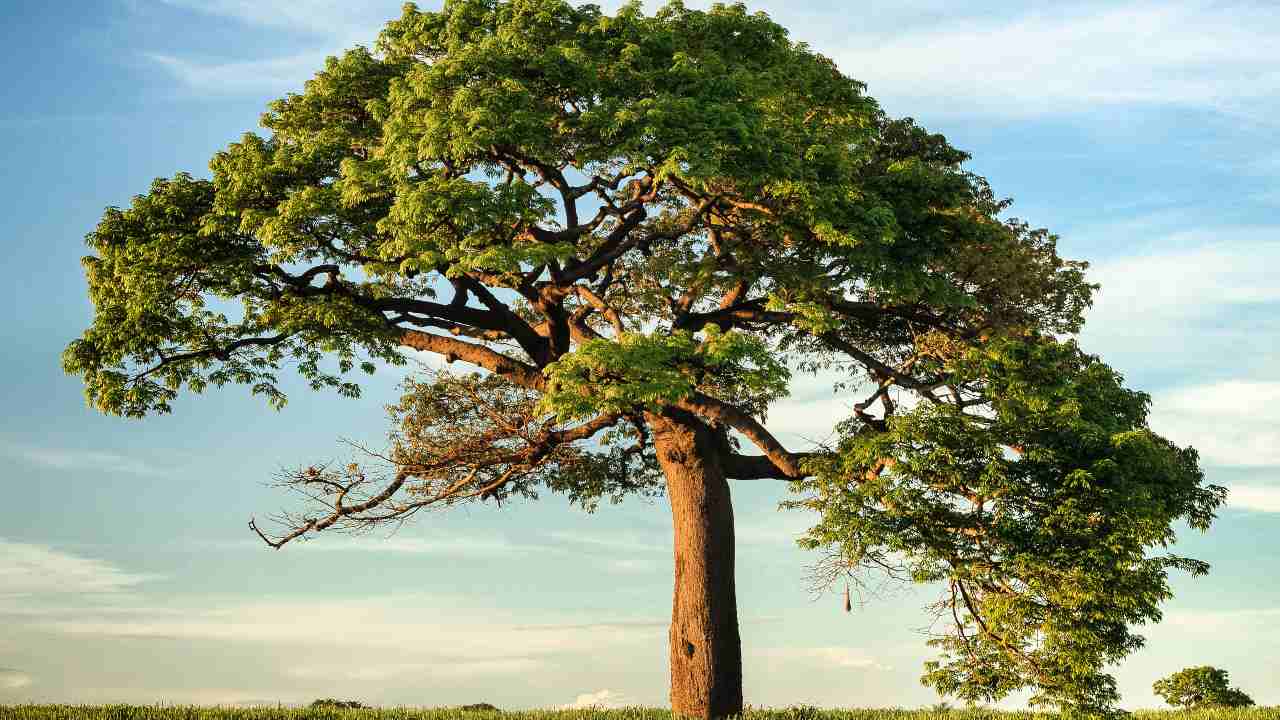
Plants and soil — especially in tropical forests — soak up about 30 percent of manmade carbon pollution[/caption]The 2015 climate treaty enjoins nations to stop global heating at "well below" two degrees Celsius, and 1.5C if possible.The planet has already warmed 1.2C above the preindustrial benchmark, enough to unleash a crescendo of deadly storms, sea level rise and other impacts.Since 1960, Earth's total forest cover has shrunk by nearly a million km2, while areas covered by cropland and pastures have each increased by roughly the same extent, the study found.But the global figures obscure important regions differences.Forest areas in the Global North — Europe, Russia, East Asia and North America — have increased in the last 60 years, while forest loss in developing countries of the Global South has been staggeringly high, the study showed.Conversely, croplands have declined in the north and expanded in the global South, especially to satisfy rich country appetites.
Demand for commodities
"Tropical deforestation has occurred for the production of beef, sugar cane and soybean in the Brazilian Amazon, oil palm in Southeast Asia, and cocoa in Nigeria and Cameroon," Winkler noted.High oil prices — peaking at around $145 per barrel of crude in 2008 — also fuelled conversion of forests to bioenergy crops.The study revealed rapid land use change — driven first by the Green revolution in the 1960-70s, and then by the expansion of globalised markets — up to 2005.But after a period of fluctuation in global markets, the pace at which land was repurposed slowed."With the economic boom coming to an end during the Great Recession (of 2008), the global demand for commodities dropped," the study noted.Earlier calculations of land use change since the mid-20th century have fallen short for a number of reasons, Winkler explained.Datasets were fragmented both in space and time, and based as much on assumptions as concrete measurements. The resolution of satellite data was coarse, and usually only distinguished between two or three categories of land.The new study drew from long-term land use statistics compiled by the Food and Agriculture Organization (FAO), identifying urban areas, croplands, forests, grasslands, pastures and regions with sparse or no vegetation, such as deserts.It also used a higher resolution of satellite images — one kilometre squared.About 17 percent of Earth's land surface has switched categories at least once since 1960, the study showed.But sometimes the same piece of real estate changed more than once. If all such transitions are taken into account, the total land surface affected was equivalent to 32 percent.Earth's skin is stretched across 510 million km2. Some 70 percent of that — 361 million km2 — is water, mostly oceans.Of the remaining 149 million km2, about 15 million km2 is permanently covered by ice, leaving 134 million km2 of ice-free land.

Careless Whispers: Scientists discover that plants can 'talk' to each other using smells
Life on Mars? European Space Agency’s Orbiter discovers ice water deposits at equator
Microsoft briefly overtakes Apple as the most valuable company, Apple back on top again
Even NASA is facing a tough time, starts layoffs following major budget cuts
ISRO, NASA's NISAR satellite to get ready by Jan-end, will monitor Earth's snow-covered regions