


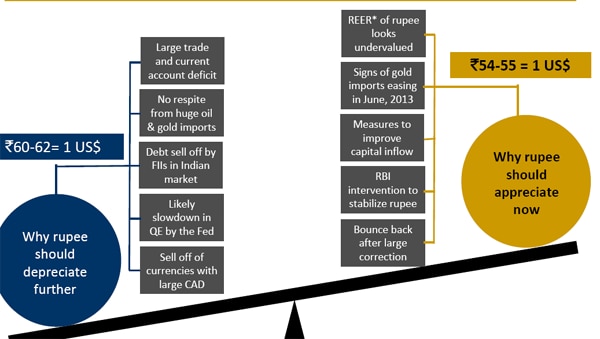
These graphs tell us why rupee fell, and why it will be up by Sep

The Indian rupee today slumped to an all-time low of 59.93 against the US dollar after the Federal Reserve signalled a tapering of its monetary stimulus, highlighting the country's dependence on foreign capital inflows to fund its current account deficit.
The graphics below by brokerage Anand Rathi explains the rupee fall:
Source:Anand Rathi[/caption]
[caption id="attachment_890507" align="alignleft" width="600"]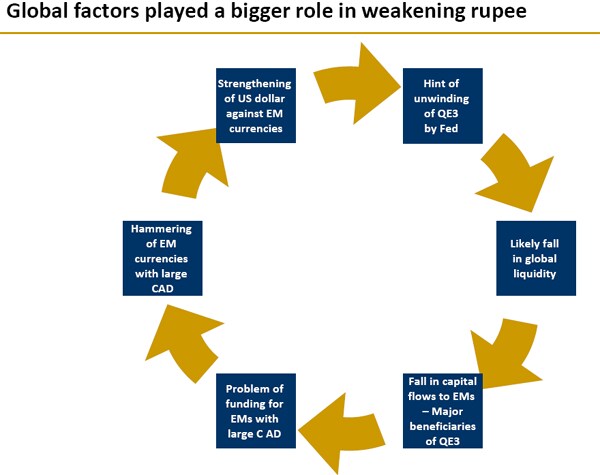
Source:Anand Rathi[/caption]
[caption id="attachment_890509" align="alignleft" width="600"]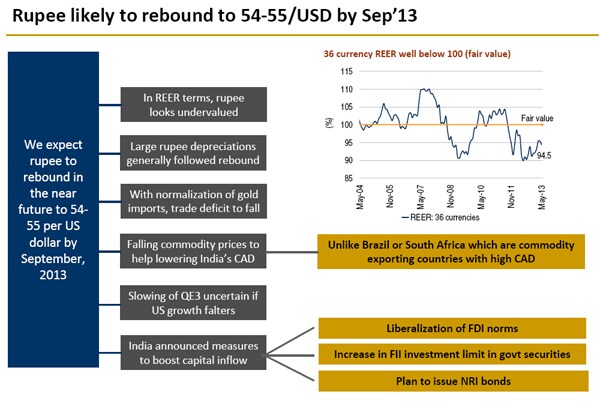
Source:Anand Rathi[/caption]
According to the brokerage, the hint of Fed tapering off the QE3 (quantitative easing) led to hammering of currencies of emerging markets (EMs) with large current account deficits (CADs).
South Africa, Turkey, India, Indonesia and Brazil have large CADs and their currencies depreciated sharply in the current currency sell off.
 More from Investing
So, maybe, it's now time to check if the rupee is about to bottom out. Anand Rathi certainly seems to think so.
