
Advertisement
Co Presented By
Co Presented By


Sections
India gets record FDI but money not enough to stir manufacturing sector from its slumber
No more than 30 percent of FDI between October 2014 and March 2017 went to manufacturing, compared to 48 percent during October 2012 to September 2014.

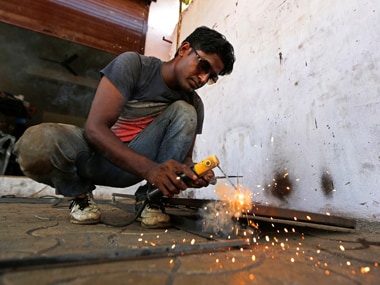 India has not been able to pump up its manufacturing of late. Reuters[/caption]FDI into sectors such as insurance, defence and direct-to-home television services–for which policy was relaxed–was responsible for 19 percent of FDI into India between October 2014 and March 2017 (the latest data available), a fall of two percentage points from 21 percent over the previous two years, said the ISID study, which analysed FDI between 2007-08 and 2016-17.The FDI inflows went to only 37 percent of companies in the manufacturing sector, 16 percent contributed to new capacity or was used to rehabilitate troubled companies over the 29 months in question, and the repatriation of FDI, technically called the disinvestment ratio–the process of sending foreign currency to another country–increased by six percentage points over six years to 2017, the ISID study said.No more than 30 percent of FDI between October 2014 and March 2017 went to manufacturing, compared to 48 percent during October 2012 to September 2014.Attracting FDI was one of the three main goals of the government’s Make-in-India programme, which made specific reference to harnessing FDI, with 25 sectors, almost half of them not in manufacturing, identified for special focus.As FDI levels reached a record high of $61 billion (Rs 4,12,887 crore), in 2017-18, the study attempted to assess how much of this investment was helping India’s economy, the world’s sixth largest. It used “best approximations”, listing “distortions” in official statistics, delayed and duplicate reporting and “notional inflows” as handicaps in calculations.FDI into India increased from $36 billion in 2013-14 to $60 billion in 2016-17, an all-time high, according to government data, but as a proportion of gross domestic product (GDP), it has declined, as FactChecker reported in June 2018.During the first term of the Congress-led United Progressive Alliance (UPA-I, April 2004 to May 2009), FDI as a proportion of GDP increased from 0.9 percent to 2.7 percent, reaching a peak of 3.6 percent in 2008 (the highest ever since 1975). During UPA-II (May 2009 to May 2014), the ratio declined from 2.7 percent to 1.7 percent and during the current NDA administration has gone from 1.7 percent to 2 percent in 2016.
 During the first term of the Congress-led United Progressive Alliance (UPA-I, April 2004 to May 2009), FDI as a proportion of GDP increased from 0.9 percent to 2.7 percent, reaching a peak of 3.6 percent in 2008 (the highest ever since 1975). During UPA-II (May 2009 to May 2014), the ratio declined from 2.7 percent to 1.7 percent and during the current NDA administration has gone from 1.7 percent to 2 percent in 2016.
Of $2.32 billion or 137 assessed investments identified by the study between October 2014 and March 2016, no more than 17 percent or $385 million contributed to new capacity creation–which includes skill building in companies, hiring and training more workers, helping firms increase production–or rehabilitation of troubled companies, the study found.FDI policy changed in August 2014The Bharatiya Janata Party-led NDA government first liberalised FDI policy in August 2014 by raising the cap on foreign investment in defence industries and allowing foreign investment to upgrade railway infrastructure.An important aspect of India’s FDI flows is the substantial amount of repatriations/disinvestments (funds that foreign firms earn in India through sale of goods and services or shares that can be sent back to their country of origin).The ratio of disinvestment/repatriation to FDI inflows, which was 30 percent during 2010-11, increased to nearly 36 percent in 2016-17. The estimate for 2017-18 (up to January) is nearly 47 percent.These figures of rising disinvestments are in addition to outward remittances by way of dividends paid by foreign companies from their Indian units to parent units abroad and payments made by Indian companies for technology and other services.“The real test of FDI policy is in attracting what we term as realistic FDI (RFDI) and getting the expected benefits from it,” the study said. “Financial investors who differ from RFDI investors invest mainly in projects initiated by domestic entrepreneurs.”
Source: Institute for Studies in Industrial Development Study Calculations *Data as of January 2018“Realistic FDI represents a packaged transfer of capital, technology, management and other skills, which takes place internally within multinational firms such as Suzuki Motors that has been in India for almost 40 years now,” KS Chalapati Rao, distinguished fellow, ISID, and co-author of the study, told IndiaSpend.Between October 2014 and March 2016, the share of RFDI was a little above 50 percent. Thus, there was no change in the broad character of inflows compared to the earlier years (2004-05 to 2013-14) to indicate a shift in the nature of inflows received till March 2016, the report said.Is Make In India attracting FDI?The Make-In-India programme aimed to develop India into a manufacturing hub, and one of the ways to do this was through FDI.Of 1,188 companies analysed for the study, only 37 percent or 442 were in the manufacturing sector and 746 were in other activities. Of the $51.7 billion FDI that these companies attracted during October 2014-March 2016, the manufacturing sector received 26 percent, while 74 percent went to non-manufacturing, including services.
| Distribution Of FDI Inflows In Manufacturing, October 2014 To March 2016 | |||||
|---|---|---|---|---|---|
| Industry | Companies | Realistic Foreign Direct Investment (RFDI, In $ million) | Non-Realistic Foreign Direct Investment (In $ million) | Total (In $ million) | Share of RFDI (In %) |
| · Transport Equipment (incl. parts, etc.) (7.9%) | 75 | 3,890.40 | 182 | 4,072.40 | 95.5 |
| · Chemicals (4.5%) | 73 | 1,693.40 | 623.9 | 2,317.30 | 73.1 |
| · Machinery & Equipment (2.7%) | 70 | 1,109.30 | 269.8 | 1,379.10 | 80.4 |
| · Food Products & Beverages (2.2%) | 46 | 897.7 | 247.3 | 1,145.00 | 78.4 |
| · Coke & Refined Petroleum Products (1.8%) | 3 | 929.5 | 6.1 | 935.6 | 99.3 |
| · Metals & Metal Products (1.4%) | 42 | 504.7 | 196.8 | 701.5 | 71.9 |
| · Electrical Machinery & Apparatus (1.4%) | 30 | 503.2 | 196.6 | 699.8 | 71.9 |
| · Rubber & Plastic Products (1.3%) | 20 | 477.9 | 193.3 | 671.3 | 71.2 |
| · Non-metallic Mineral Products (0.5%) | 19 | 195.5 | 88.7 | 284.2 | 68.8 |
| · Paper & Paper Products (0.4%) | 7 | 185.6 | 20.8 | 206.5 | 89.9 |
| · Radio, Television & Communication | 8 | 100.9 | 78.9 | 179.8 | 56.1 |
| · Medical, precision & optical instruments,etc. (0.3%) | 10 | 117.3 | 26.1 | 143.5 | 81.7 |
| · Office, Accounting & Computing machinery (0.2%) | 5 | 112.6 | 7.9 | 120.6 | 93.4 |
| Total | 442 | 11,070.00 | 2,492.30 | 13,562.40 | 81.6 |
| Sectoral Distribution Of FDI Inflows | ||||
|---|---|---|---|---|
| Sector | Oct 2012 – Sept 2014 | Oct 2014 – March 17 | 2015-16 | 2016-17 |
| Services | 44% | 64% | 69% | 62% |
| Manufacturing | 48% | 30% | 25% | 33% |
| Energy (incl. Petroleum & Natural Gas) | 6% | 4% | 4% | 5% |
| Primary | 2% | 1% | 1% | 0.30% |
| All Sectors | 100% | 100% | 100% | 100% |
| Inflows ($ billion) | 48.4 | 99.7 | 40 | 43.5 |
First Published:Sep 05, 2018, 16:04:14 IST
Advertisement
Advertisement

No premium queues, 30-minute target: What changes for Indian passport applicants in UAE
Indian passport applicants in the UAE can now access passport, visa and attestation services through Alhind’s 16 centres, with no premium queues, a Dh19 service fee and a target of completing applications within 30 minutes
4 min read
Bharat Forge, Flying Whales sign pact to develop 60-tonne airships for India’s defence logistics
Bharat Forge has signed an MoU with Flying Whales to jointly develop and manufacture 60-tonne heavy-lift airships in India for defence logistics, strategic mobility and disaster response
3 min read
Air India to cut Delhi-Toronto flight time by 3 hours, resume non-stop services from August 1
Air India will resume non-stop Delhi-Toronto flights from August 1, cutting travel time by nearly three hours and deploying its new Boeing 787-9 Dreamliner on the route
2 min read
South Korea economy grows faster than expected in Q2 as chip exports power recovery
South Korea’s economy grew 0.6% in the second quarter, beating expectations as strong semiconductor exports offset weakness in construction investment and domestic demand
2 min read
India remains among fastest-growing major economies despite global uncertainty, says RBI Bulletin
RBI says industrial and services activity stayed resilient through June, while strong trade, stable external sector and improving foreign investment continue to support economic growth.
1 min read
Advertisement
Advertisement